ROC (Receiver operating characteristic)
2 Dec 2017
This is an introductory overview in what i have undestand as ROC Receiver operating characteristic. Its origin comes from the americans in 1941 after Harbour attack in their identification of the japanese airplanes through his radar signal.
Following comes a traduction on python of an example video that show how ROC works video
Let’s assume there are 10 patients with an ABT (Absolut neutrophil count) as follows and the result of severe infection (IBG).
Next to this table is the list of ABT values with positive ABT(1) and with negatie ABT(0)
| ABT | IBG | values ANC(1) | values ANC(0) | ||
|---|---|---|---|---|---|
| 12 | 1 | 12 | 8 | ||
| 8 | 0 | 15 | 8 | ||
| 15 | 1 | 9 | 9 | ||
| 9 | 1 | 12 | 3 | ||
| 12 | 1 | 10 | 3 | ||
| 8 | 0 | ||||
| 9 | 0 | ||||
| 3 | 0 | ||||
| 10 | 1 | ||||
| 3 | 0 |
We list all the different values, and count in the right the number of cases >= this value in both positive and negative. Last table is the normalized result (0..1)
| ABT(1,0) | ABT(1) | ABT(0) | ABT(1) | ABT(0) | ||
|---|---|---|---|---|---|---|
| 3 | 5 | 5 | 1 | 1 | ||
| 8 | 5 | 3 | 1 | 0.6 | ||
| 9 | 5 | 1 | 1 | 0.2 | ||
| 10 | 4 | 0 | 0.8 | 0 | ||
| 12 | 3 | 0 | 0.6 | 0 | ||
| 15 | 1 | 0 | 0.2 | 0 | ||
| 0 | 0 | 0 | 0 |
Note: Last row of result (0, 0) has been added if there is no case that none of both positive and negative is 0.
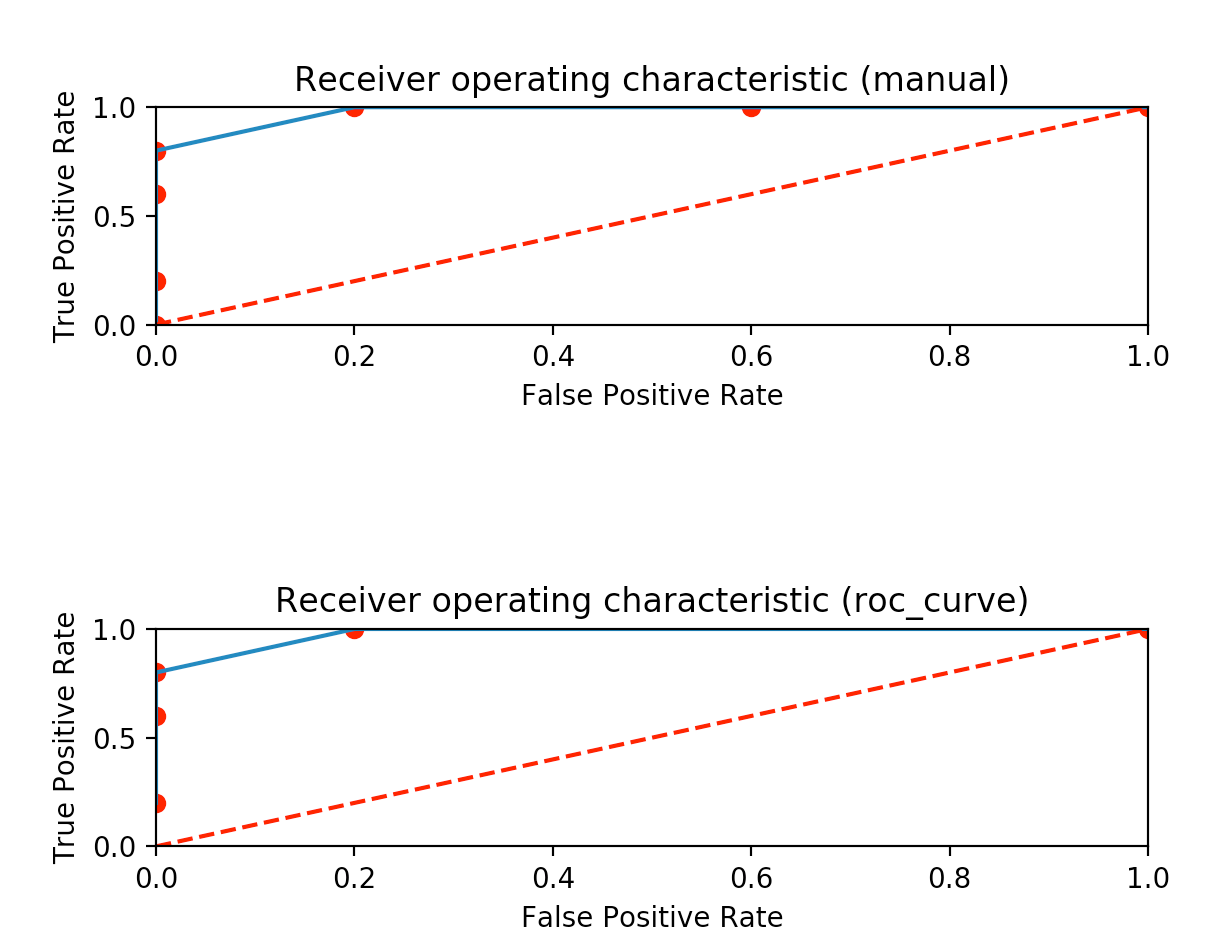
I have plotted the result manually by doing the same procedure with python code and comparing results with the roc_curve library that does the same. Both results can be shown after the code.
import numpy as np
import matplotlib.pyplot as plt

# View images

def main():

  #ABT, IBG
  #ABT: Recuento de abastonados
  #IBG: Infeccion Bacteriana grave

  data = np.array([[12, 1], [8,0],[15,1], [9,1], [12,1], [8,0], [9,0], [3,0], [10,1], [3,0]])

  abt_1 = np.array([])
  abt_0 = np.array([])
  for e in data:
    if e[1] == 1:
      abt_1 = np.append(abt_1,e[0])
    if e[1] == 0:
      abt_0 = np.append(abt_0,e[0])

  print("abt_0 - recuento de abastonados de sujetos que no tienen infeccion: {}").format(abt_0)
  print("abt_1 - recuento de abastonados de sujetos que si tienen infeccion: {}").format(abt_1)

  abt_0_y_1 = np.append(abt_0, abt_1)
  abt_0_y_1 = np.unique(abt_0_y_1)
  abt_0_y_1 = np.sort(abt_0_y_1)

  abt_0_sup = np.array([])
  abt_1_sup = np.array([])
  for e in abt_0_y_1:
    count = 0
    for f in abt_1:
      if f >= e:
        count+=1
    abt_1_sup = np.append(abt_1_sup,count)
    count = 0
    for f in abt_0:
      if f >= e:
        count+=1
    abt_0_sup = np.append(abt_0_sup,count)

  if abt_0_sup[-1] != 0 or abt_1_sup[-1] != 0:
    abt_0_sup = np.append(abt_0_sup,0)
    abt_1_sup = np.append(abt_1_sup,0)

  abt_0_sup = abt_0_sup / abt_0_sup.max()
  abt_1_sup = abt_1_sup / abt_1_sup.max()

  print("todos: {}").format(abt_0_y_1)
  print("numero de casos encima umbral de apt_1: {}").format(abt_1_sup)
  print("numero de casos encima umbral de apt_0: {}").format(abt_0_sup)

  fig = plt.figure()
  plt1 = fig.add_subplot(311)
  plt1.plot(abt_0_sup, abt_1_sup, 'ro')
  plt1.plot(abt_0_sup, abt_1_sup)
  plt1.plot([0, 1], [0, 1],'r--')
  plt1.set_xlim([0.0, 1.0])
  plt1.set_ylim([0.0, 1.0])
  plt1.set_xlabel('False Positive Rate')
  plt1.set_ylabel('True Positive Rate')
  plt1.set_title('Receiver operating characteristic (manual)')

  y = np.array([])
  X = np.array([])
  for e in data:
    y = np.append(y,e[1])
    X = np.append(X,e[0])
  X = X / X.max()

  print("True binary labels y: {}").format(y)
  print("Target scores X: {}").format(X)

  from sklearn.metrics import roc_curve
  fpr, tpr, thresholds = roc_curve(y, X)

  print("numero de casos encima umbral de apt_1: {}").format(tpr)
  print("numero de casos encima umbral de apt_0: {}").format(fpr)

  plt2 = fig.add_subplot(313)
  plt2.plot(fpr, tpr, 'ro')
  plt2.plot(fpr, tpr)
  plt2.plot([0, 1], [0, 1],'r--')
  plt2.set_xlim([0.0, 1.0])
  plt2.set_ylim([0.0, 1.0])
  plt2.set_xlabel('False Positive Rate')
  plt2.set_ylabel('True Positive Rate')
  plt2.set_title('Receiver operating characteristic (roc_curve)')

  plt.show()

if __name__ == "__main__":
    import sys
    main()